Pada tutorial sebelumnya yaitu tentang CFA menggunakan SmartPLS sudah
dijabarkan bagaimana memulai sebuah project dan melakukan CFA. Kali ini
tutorialnya adalah bagaimana melakukan pengecekan apakah data yang sudah
dianalisis menggunakan CFA it reliable dan valid sehingga nantinya kita
bisa menentukan hypotheses yang kita punya significant atau tidak.
After do the confirmatory factor analysis, you can do a further analysis using Bootstrapping Method... click on the bootstrap menu on the top menu.

You can see a dialog box...but just click Finish...

Then your values will be different than before...

If you want to see the full report, you must click Report then a report window will appear...

In here you see the t-value of each items... click in the Bootstrapping - Outer Loadings

And also in here you can see the t-value of each path coefficient in the Bootstrapping - Path Coefficients (Mean, STDEV, T-values)

But those method not enough... you need to evaluate again using SmartPLS Algorithm again....

Then, you can see the values change again... :p But it's not a loadings... it is a path coefficient...

Open the report and this report is for your final results...let's take a look....

in the path coefficient, you can see the value of coefficient...

In the Latent Variable Correlation, you can see the correlation matrix. Based on the Cornell and Larcker research, the correlation between the same variables (Ci - Ci = 1) need to be changed to the square root of the AVE values and the result need to be greater than other correlation between that variables with other variables...
Example :
AVE CI = 0.87
maybe for example only the square root of 0.87 is 0.97...
So, you can see the other correlation between CI and E, CI and PEOU, and CI and EU are less than 0.97... means the data are reliable...

To see the AVE, you can see in the overview...

So, if you want to know your path or relationship or the line between variables or sometimes called hypotheses are significant or not...you need to make this kind of table...
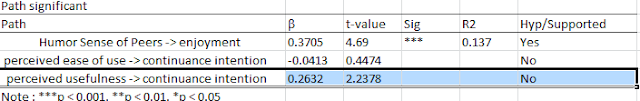
Beta is the path significant...
T-value...you already have it right?
Then, how to know it's significant?
You can see there are some p that less than 0.001 , 0.01, or 0.05... it is one-tailed t-test...
you need to know what your df... if your data is 55...your df is 54...
Then, the (*) in the p is the significant level...
Open your excel and make this equation
= TINV(df, p)
Example : = TINV(54, 0.01) ... then ENTER... the result is 2.6699
Means that the 0.01 significant level or p < 0.01, requires a t-value > 2.6699
As you can see in the table, the t-value of 3rd row is 2.2378... it is less than 2.6699... So, it's not significant... then Hypotheses is not supported...
Semoga bermanfaat :)
After do the confirmatory factor analysis, you can do a further analysis using Bootstrapping Method... click on the bootstrap menu on the top menu.

You can see a dialog box...but just click Finish...

Then your values will be different than before...

If you want to see the full report, you must click Report then a report window will appear...

In here you see the t-value of each items... click in the Bootstrapping - Outer Loadings

And also in here you can see the t-value of each path coefficient in the Bootstrapping - Path Coefficients (Mean, STDEV, T-values)

But those method not enough... you need to evaluate again using SmartPLS Algorithm again....

Then, you can see the values change again... :p But it's not a loadings... it is a path coefficient...

Open the report and this report is for your final results...let's take a look....

in the path coefficient, you can see the value of coefficient...

In the Latent Variable Correlation, you can see the correlation matrix. Based on the Cornell and Larcker research, the correlation between the same variables (Ci - Ci = 1) need to be changed to the square root of the AVE values and the result need to be greater than other correlation between that variables with other variables...
Example :
AVE CI = 0.87
maybe for example only the square root of 0.87 is 0.97...
So, you can see the other correlation between CI and E, CI and PEOU, and CI and EU are less than 0.97... means the data are reliable...

To see the AVE, you can see in the overview...

So, if you want to know your path or relationship or the line between variables or sometimes called hypotheses are significant or not...you need to make this kind of table...
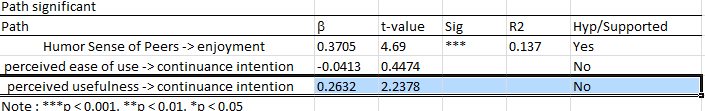
Beta is the path significant...
T-value...you already have it right?
Then, how to know it's significant?
You can see there are some p that less than 0.001 , 0.01, or 0.05... it is one-tailed t-test...
you need to know what your df... if your data is 55...your df is 54...
Then, the (*) in the p is the significant level...
Open your excel and make this equation
= TINV(df, p)
Example : = TINV(54, 0.01) ... then ENTER... the result is 2.6699
Means that the 0.01 significant level or p < 0.01, requires a t-value > 2.6699
As you can see in the table, the t-value of 3rd row is 2.2378... it is less than 2.6699... So, it's not significant... then Hypotheses is not supported...
Semoga bermanfaat :)


0 comments:
Post a Comment